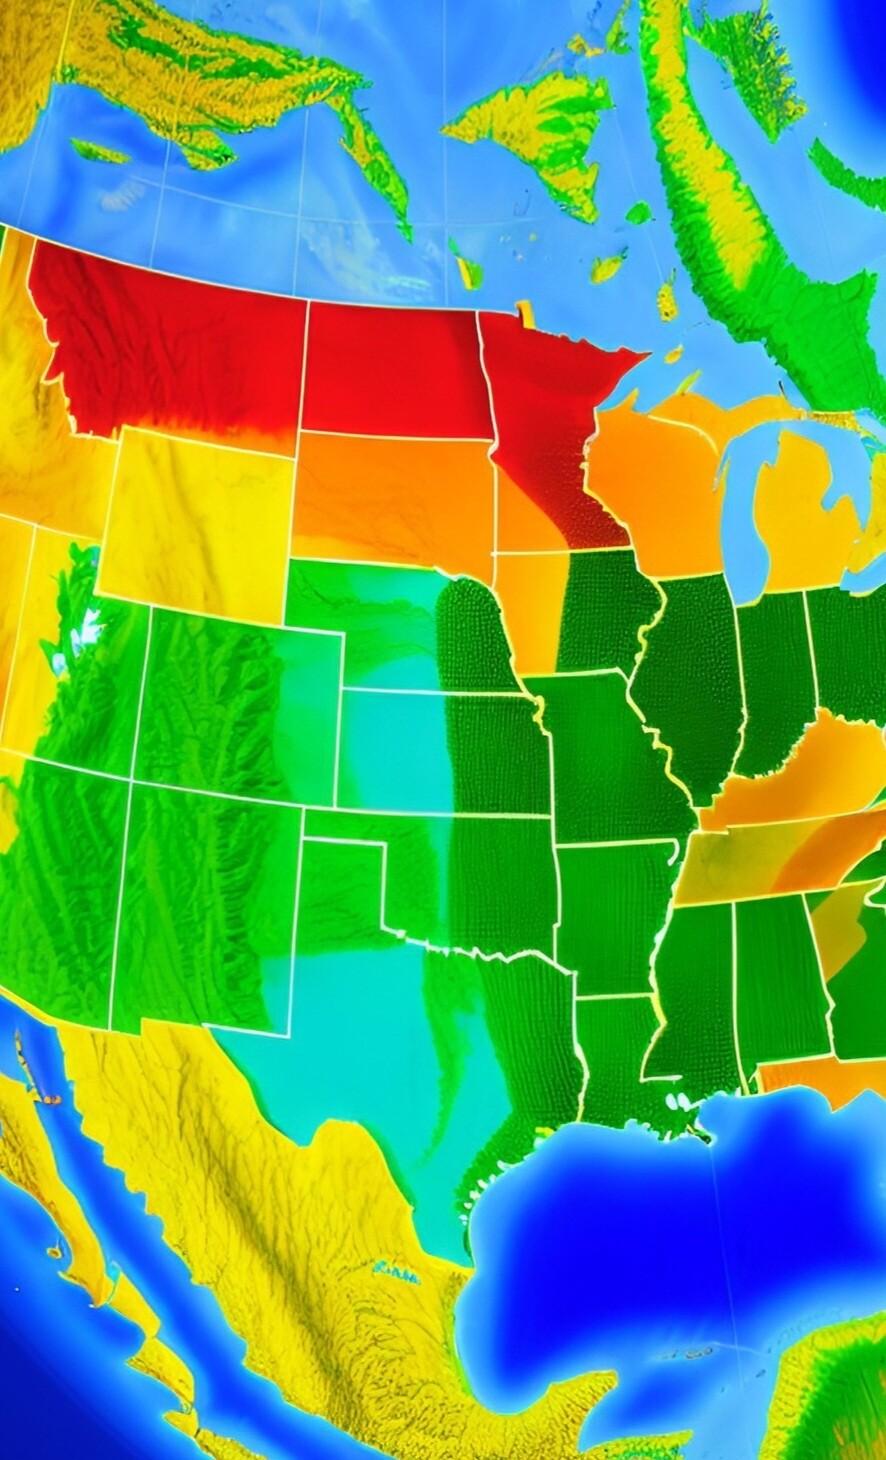
USDA Hardiness Zones Explained
A USDA Hardiness Zone is a geographical region defined by the USDA (United States Department of Agriculture) that classifies the minimum temperatures a plant can tolerate in that area. The USDA hardiness zone map provides a guide for gardeners and horticulturists to determine which plants can survive in specific locations. The map defines 13 zones by long-term average annual extreme minimum temperatures. It has been adapted by and to other countries (such as Canada) in various forms.
The importance of knowing your USDA Hardiness Zone lies in selecting the right plants for your garden. Choosing plants that are well-suited to your zone can lead to a more successful and low-maintenance garden. Knowing your zone can help you pick plants that are more likely to survive and thrive in your area, saving you time and money.
The USDA Hardiness Zone concept began in the 1960s, when the USDA first created a map to provide gardeners and horticulturists with information about which plants were most likely to survive in specific regions. The first USDA Hardiness Zone map was created by a team of scientists who collected data from weather stations across the country. The map was based on the average minimum temperature of each region, and was divided into 11 zones, each with a 10-degree Fahrenheit difference.
In 1990, the USDA updated the map, taking into account new weather data and incorporating new technologies. The updated map was divided into 13 zones, each with a 5-degree Fahrenheit difference, providing a more precise and accurate representation of the minimum temperatures a region can expect.
In 2012, the USDA published its most recent hardiness zone map, which incorporated data from over 1,400 weather stations across the country and took into account temperature trends resulting from climate change. The updated map provides gardeners and horticulturists with the most up-to-date information about the minimum temperatures of specific regions and the plants that are most likely to survive in those areas. The 2012 map was created digitally for the internet, and includes a ZIP Code zone finder and an interactive map.
In 2015, the Arbor Day Foundation revised another map, also with no a and b subdivisions, showing many areas having zones even warmer, with the most notable changes in the Mid Atlantic and Northeast, showing cities like Philadelphia, New York City and Washington D.C in zone 8, due to their urban heat islands.
The USDA Hardiness Zone map is an important tool for gardeners and horticulturists to determine the best plants for their specific regions. The map provides valuable information about the minimum temperatures a region can expect and helps to select plants that are well-suited to thrive in that area. By knowing your USDA Hardiness Zone, you can save time and money and create a more successful and low-maintenance garden.
